Anderson Vacations
November 2025 – July 2026
What changed
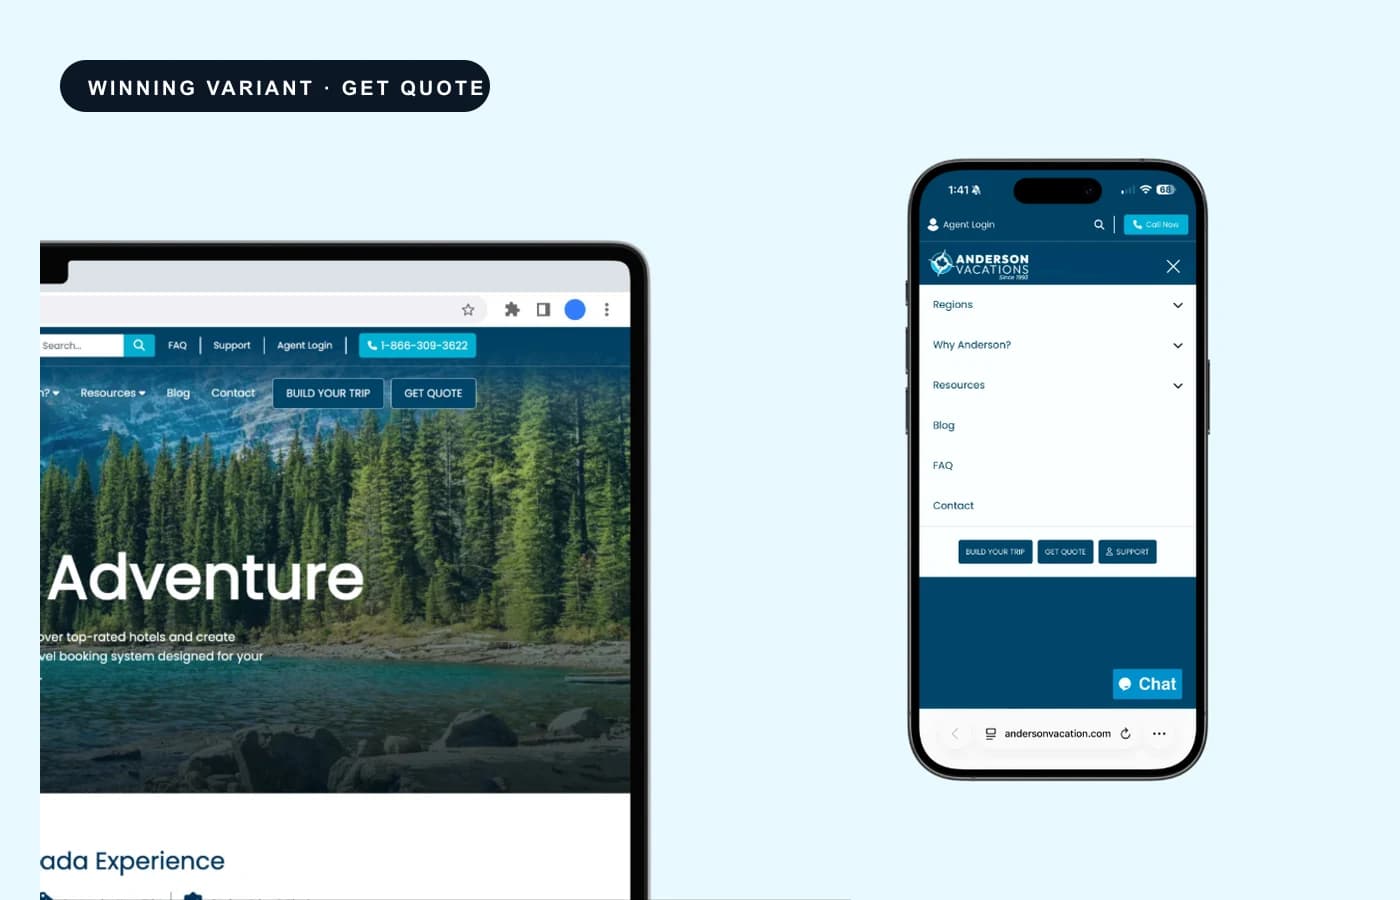
The strongest result came from making the Get Quote action more prominent within the trip-browsing experience. In the controlled experiment, the variant produced a higher Get Quote click rate on both desktop and mobile devices.
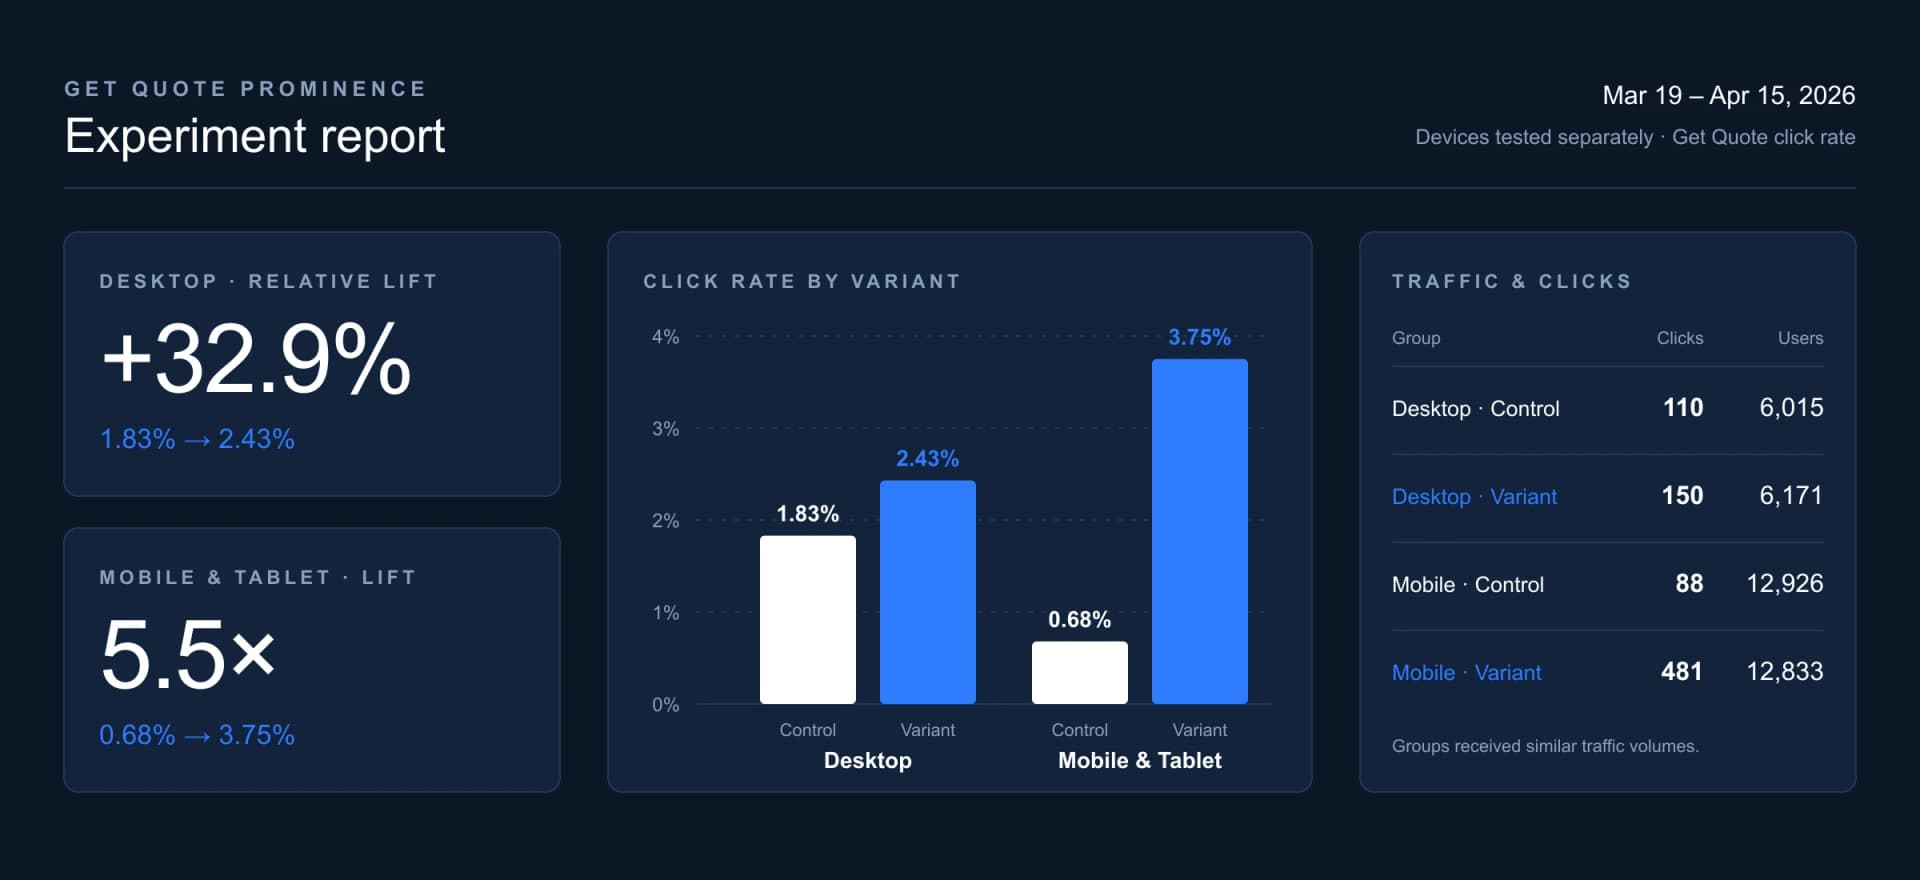
+32.9%
Desktop Lift
The Get Quote click rate increased from 1.83% to 2.43% on desktop, showing a clear engagement lift.
5.5×
Mobile Rate
The mobile and tablet variant reached a 3.75% Get Quote click rate, compared with 0.68% for the control.
+26.6%
Region Progression
The share of homepage visitors continuing to a region page rose from 18.03% to 22.82%.
Unclear path
Planning a guided vacation is a high-consideration decision. Visitors may compare destinations, departure dates, itineraries and travel styles before they are ready to speak with someone. They can also enter the website at very different points from the homepage and search results to blog articles, regional pages or individual trips so the path to inquiry is rarely a straight line.
The challenge was not simply to add more calls to action. It was to understand where visitors needed a clearer next step and determine which changes actually influenced their behaviour.
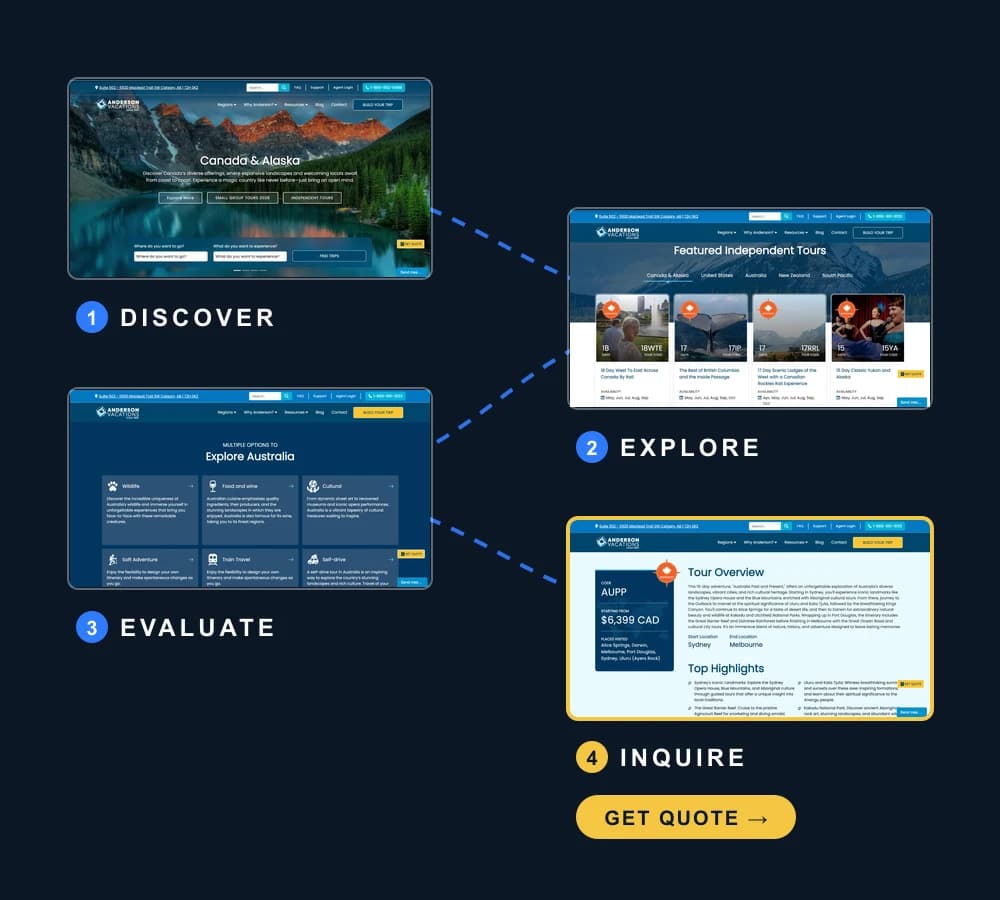
 [01]
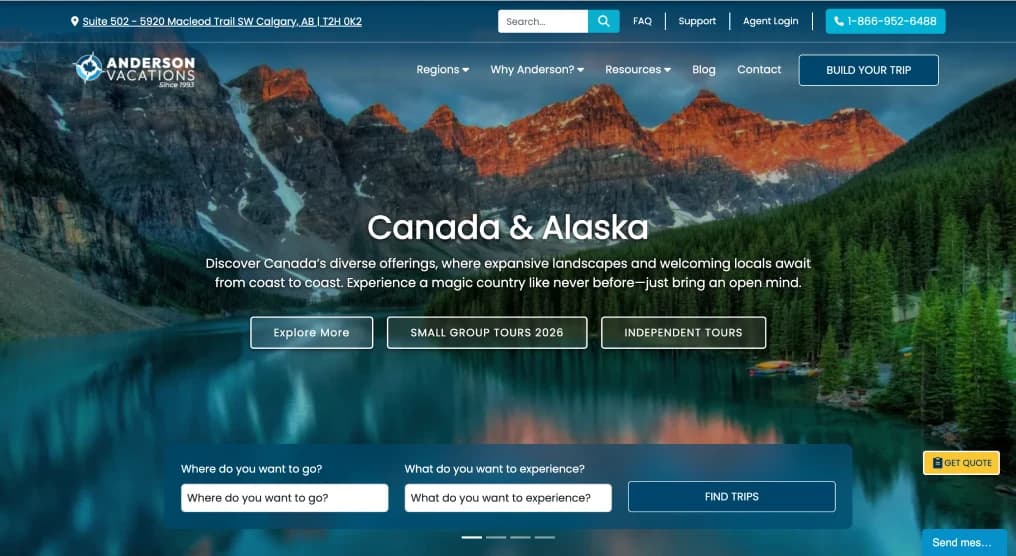
[01]Discover
Homepage · Search · Blog content
 [02]
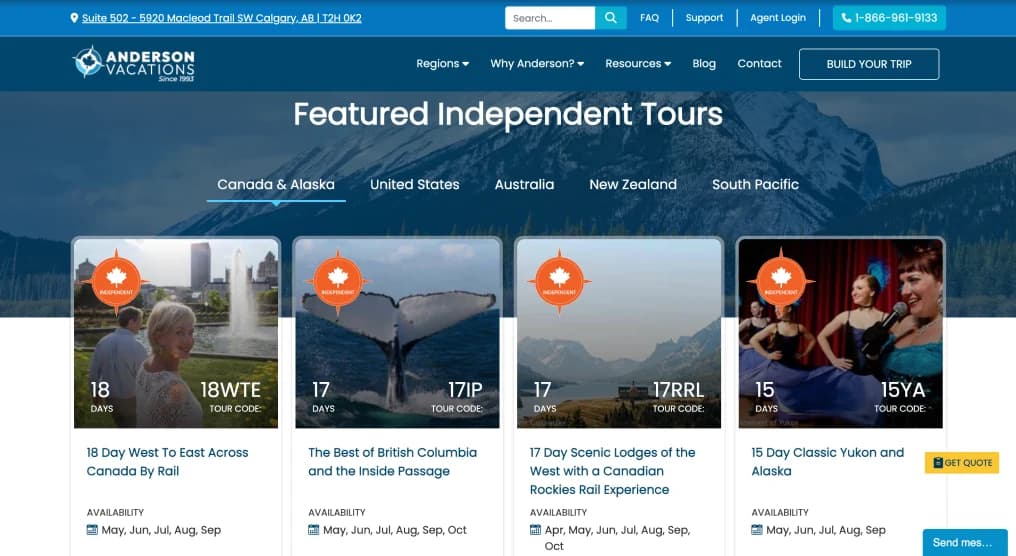
[02]Explore
Regions · Places · Travel styles
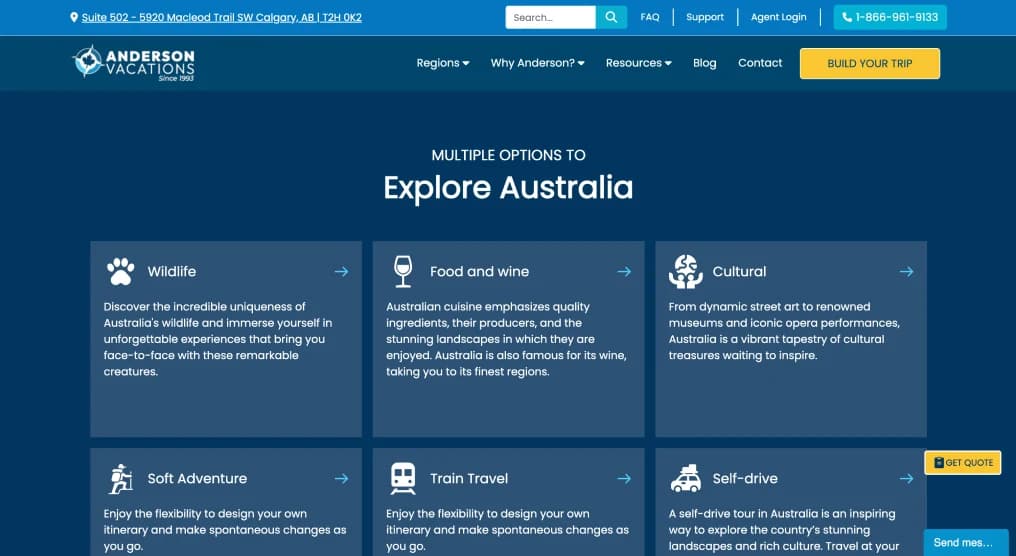 [03]
[03]Evaluate
Trip pages · Itineraries · Reviews
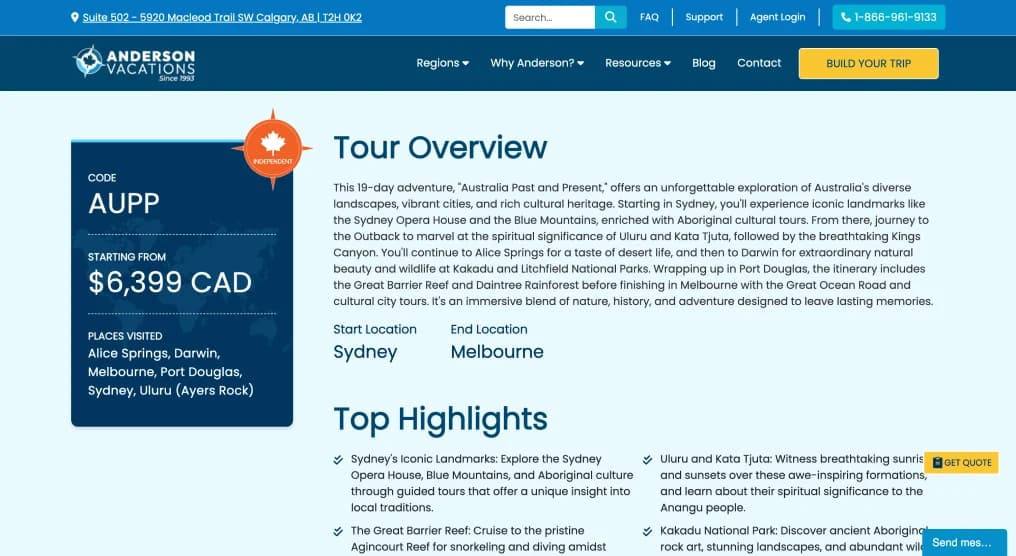 [04]
[04]Inquire
Get Quote · Trip reservation
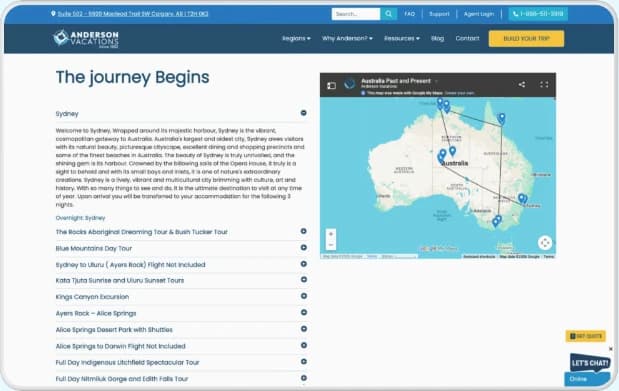
Itinerary Structure
- 1Long destination overview before the remaining itinerary.
- 2Travellers must open each stop individually to understand the full itinerary.
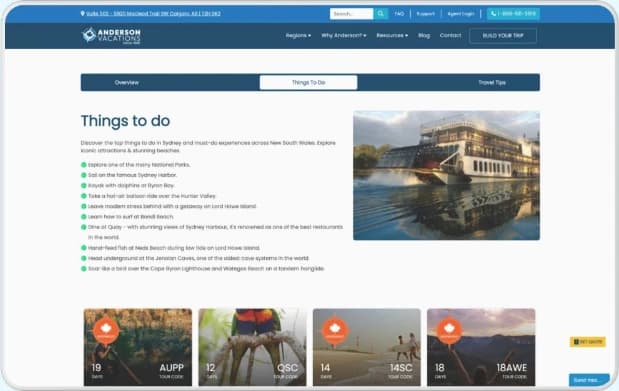
Quote Visibility
- 1Informational content did not provide a clear route to a relevant trip.
- 2Get Quote sat outside the primary navigation.
Test the journey
CRO was approached as an ongoing program of focused experiments rather than one large redesign. Each test addressed a specific part of the visitor journey and was measured separately across desktop and mobile where appropriate.
01
Measure
Review click behaviour, visitor pathways and movement between important pages.
02
Prioritize
Focus first on areas closest to meaningful actions, particularly trip exploration and quote inquiries.
03
Experiment
Compare the existing experience with a focused variation designed to address one clear hypothesis.
04
Learn
Use positive, neutral and negative results to decide what should be developed, reconsidered or tested next.
Testing Focus
- Get Quote prominence
- Inquiry
- Itinerary organization
- Scannability
- Award visibility
- Credibility
- Contextual blog prompts
- Relevance
- Review summaries
- Confidence
- Trip activity ticker
- Urgency
“Get Quote”
Visitors can spend considerable time comparing destinations and reviewing trip details before they are ready to inquire, so once that intent develops, the next action needs to be immediately recognizable. The Get Quote Prominence experiment examined whether giving the quote action stronger visual priority would encourage more visitors to use it.
Hypothesis
If Get Quote is easier to notice, more travellers will use it.
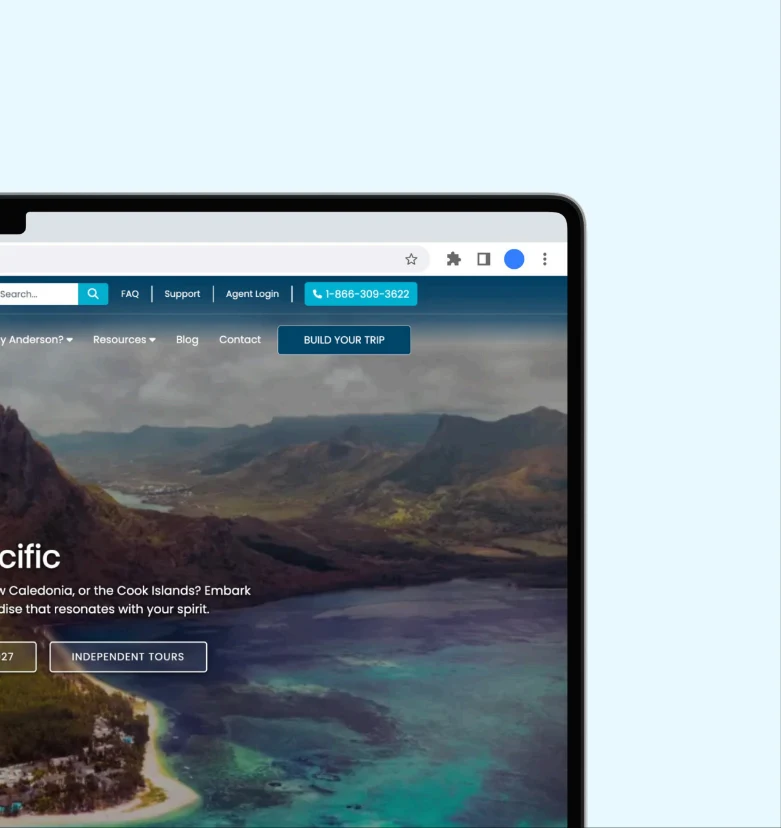
Control
The original Get Quote treatment and visual hierarchy.
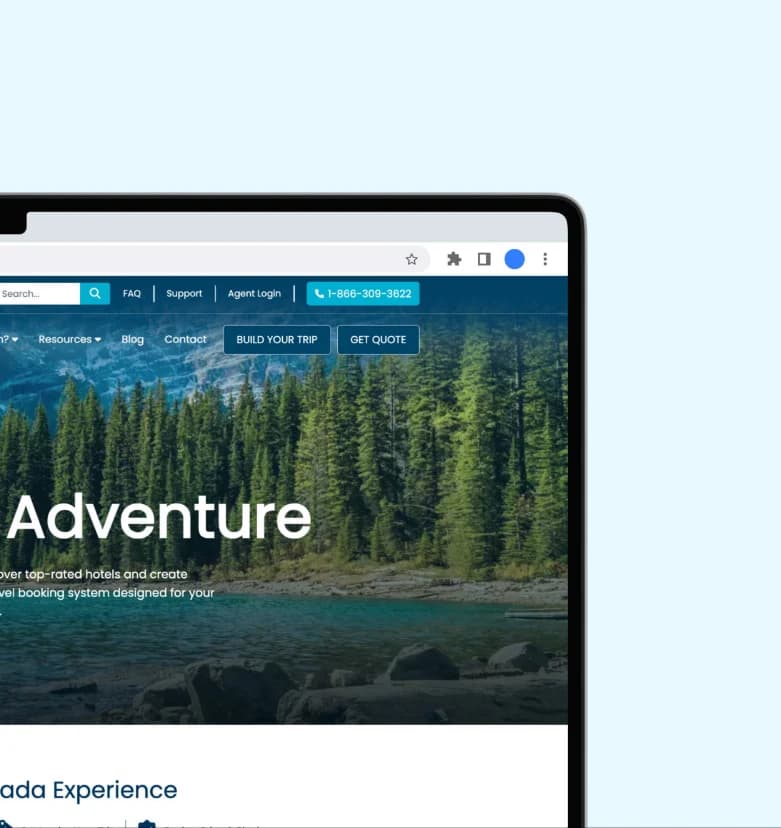
Variant
A more prominent treatment designed to make the inquiry action easier to identify.
[+32.9%]
Observed relative lift
The variant produced a higher Get Quote click rate while the two experiment groups received similar traffic volumes.
1.83% → 2.43%
- Control
- 110 clicks · 6,015 users
- Variant
- 150 clicks · 6,171 users
- Test period
- Mar 19 – Apr 15, 2026
- Measured action
- Get Quote click rate
- Reporting
- Devices tested separately
Wider program
The Get Quote test produced the clearest result, but it was one part of a broader experimentation program. Other tests explored how content organization, trust signals and contextual prompts affected visitor behaviour.
| Experiment | What it explored | Status in the dataset | Reading |
|---|---|---|---|
| Get Quote prominence | Visibility of the primary inquiry action | Concluded | Strongest observed result |
| Itinerary accordion | Make detailed trip information easier to scan | Concluded | Smaller positive desktop direction |
| Award visibility | Positioning recognition as a trust signal | Concluded | Mixed results across devices |
| Contextual blog prompts | Connecting informational content with relevant trips | Concluded | Mixed results |
| Review summary | Bringing social proof closer to trip evaluation | Live in report | Early directional differences only |
| Trip ticker | Testing activity or urgency messaging | Live in report | Mixed, low volume results |
More inquiries
A Google Analytics funnel comparison across two consecutive 28-day periods found that, although homepage users fell from 2,147 to 1,976, a higher proportion continued into several important areas of the website.
8.0% fewer homepage users
2,147 earlier → 1,976 later
| Journey | Earlier | Later | Relative increase |
|---|---|---|---|
| Home → Regions | 18.03% | 22.82% | +26.6% |
| Home → Trip Page | 34.00% | 36.99% | +8.8% |
| Home → Build Your Trip | 3.35% | 3.69% | +10.2% |
[ 28-day periods ] May 26–Jun 22 → Jun 23–Jul 20 / 2026
The clearest path forward came from making the next step clearer.
Data insights
The Get Quote experiment provided the strongest evidence that clear action hierarchy mattered, especially on mobile and tablet. Across the wider program, smaller gains and mixed or negative results helped distinguish promising opportunities from ideas that needed more work, giving Anderson Vacations a stronger basis for future website decisions.
Action Clarity
When visitors are ready to inquire, the next step should not compete with the surrounding content.
Mobile Differences
A treatment that creates a moderate difference on desktop can behave very differently within a smaller mobile interface.
Mixed Results
Awards, reviews, recommendations and urgency messaging can sound persuasive in theory. Testing reveals whether they actually support the visitor journey.
Careful Attribution
Controlled experiments provide stronger evidence about a specific change. Period comparisons can reveal movement, but should not be treated as isolated attribution.